Case Studies
Helped a freight forwarding SME save ₹15 Lakhs annually by streamlining invoice and contract processes.
We identified leakages in freight contracts, standardized invoicing formats, and implemented weekly audits.
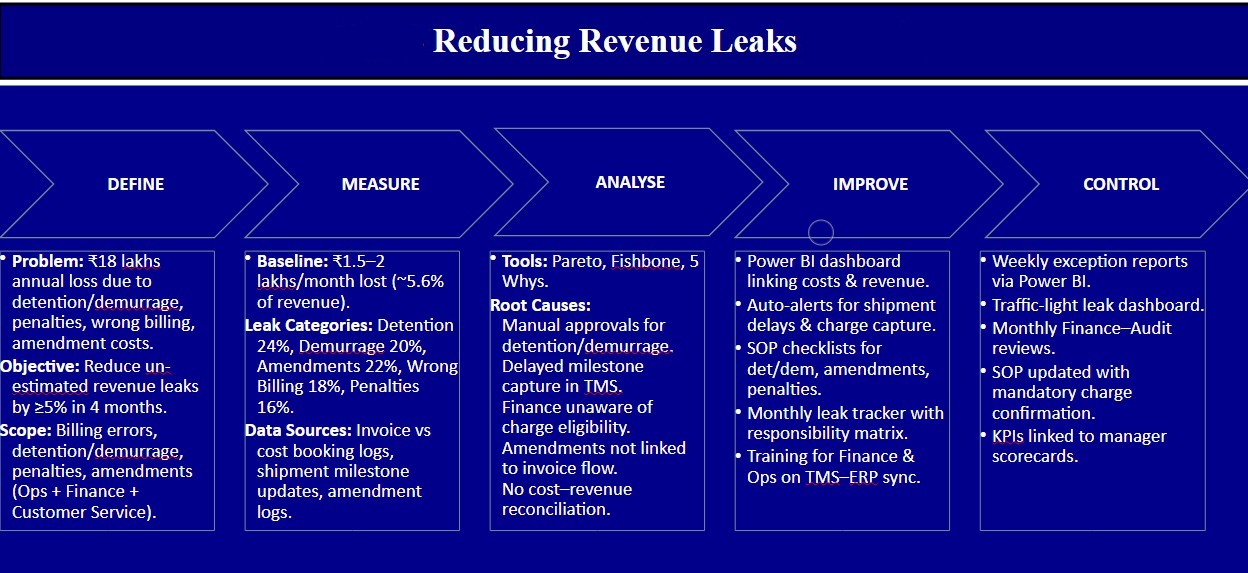
Challenge: ₹18L annual loss from detention, demurrage, penalties, and wrong billing.
Actions: Power BI dashboards linked costs & revenue; SOPs, alerts, and team training implemented.
Impact:
Improved on-time deliveries by 18% in 6 months for a logistics service provider using Lean principles.
Optimized route planning, enhanced partner visibility, and implemented driver performance dashboards.
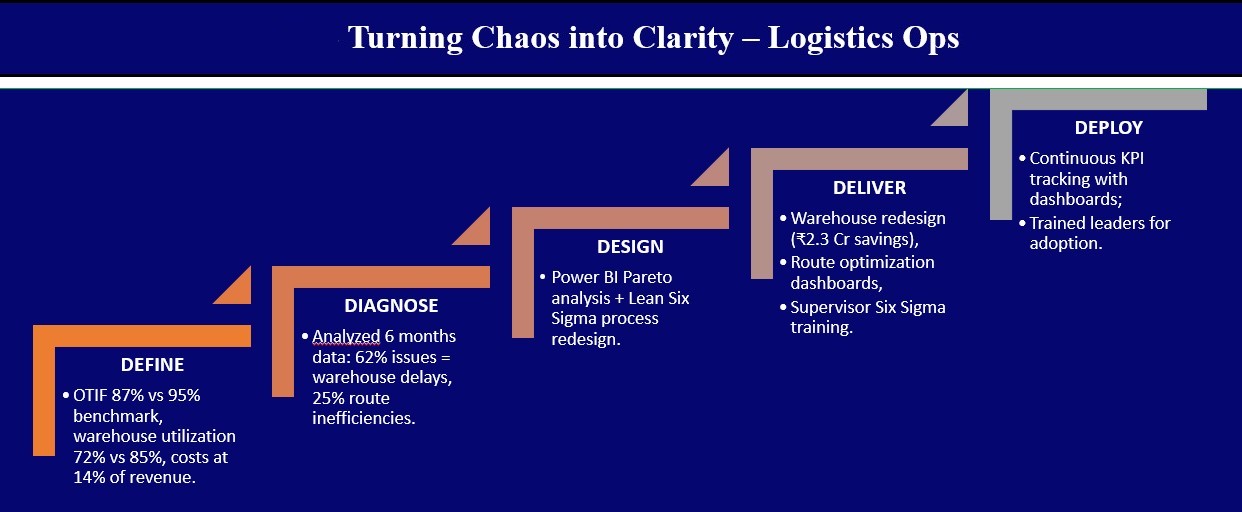
Challenge: OTIF 87% vs target 95%; warehouse utilization only 72%; logistics costs 14% of revenue.
Actions: Implemented Lean Six Sigma redesign, Power BI dashboards, and supervisor performance training to streamline operations.
Impact:
Reduced operational expenses by ₹10 Lakhs annually by process re-engineering and automation.
Introduced Power Automate workflows and digitized documentation across 5 key logistics operations.
Challenge: 7.5% error rate in bookings, customs entries, and invoicing.
Actions: Introduced standardized templates, Power BI error dashboards, and automated validation scripts to eliminate manual mistakes.
Impact:

Implemented Power BI dashboards enabling SMT to act on real-time data insights effectively.
Established KPIs, connected Excel data models, and trained teams for actionable data interpretation.
Challenge: CEO reviews filled with conflicts; financial, operations, and sales data didn’t match.
Actions: Integrated a unified Power BI dashboard combining Finance, Operations, and Sales data sources for one source of truth.
Impact:

Delivered 15+ training sessions, increasing staff productivity and engagement measurably.
Developed skill-matrix-driven learning paths and certified employees on key logistics competencies.
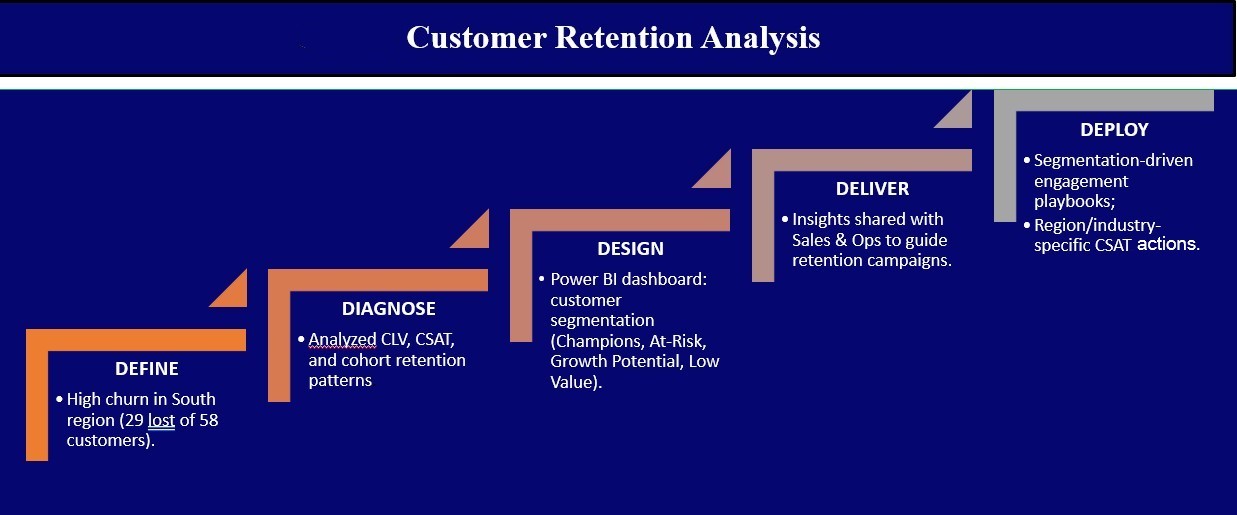
Challenge: High churn (29 of 58 customers lost).
Actions: Conducted CLV (Customer Lifetime Value) & CSAT analysis in Power BI, identified churn patterns, and launched segmentation-driven retention campaigns.
Impact: