Logistics KPIs India, Freight forwarding performance metrics, Supply chain dashboard KPIs, Power BI logistics dashboard, 3PL operations analytics, MSME logistics metrics
Introduction
For every MSME in logistics, warehousing, 3PL, or freight forwarding, growth isn’t about working harder — it’s about measuring smarter.
Key Performance Indicators (KPIs) form the backbone of operational intelligence.
They help leadership teams monitor performance, find bottlenecks, and make informed decisions.
This guide lists the most critical KPIs across functions — Operations, Sales & Business Development, Customer Service, Finance, and HR — for MSMEs in logistics, warehousing, and freight forwarding.
🛣️ 1. Logistics / Transportation KPIs
| Function | KPI Name | What It Measures | Why It Matters |
|---|---|---|---|
| Operations | On-Time Delivery % | % of shipments delivered as per schedule | Directly reflects service reliability & customer satisfaction |
| Vehicle Utilization % | Ratio of actual trips to available fleet capacity | Measures efficiency of asset usage | |
| Cost per Kilometer | Total transport cost divided by total distance | Helps control operating expenses | |
| Empty Run Ratio | % of distance covered without cargo | Indicates inefficiencies in trip planning | |
| Fuel Efficiency (KM/Litre) | Average mileage of fleet | Impacts cost and sustainability | |
| Delay Causes by Category | Reasons for delivery delays (internal vs external) | Helps identify process bottlenecks | |
| Sales & BD | Quote-to-Booking Ratio | % of quotes converted to confirmed shipments | Measures effectiveness of pricing and BD team |
| Average Freight per Ton-KM | Revenue earned per unit distance | Shows pricing efficiency | |
| Customer Win Rate | Ratio of new customers won vs leads | Tracks business expansion success | |
| Customer Service | Complaint Resolution Time | Avg. time to resolve customer complaints | Indicates responsiveness and service quality |
| Customer Retention % | % of repeat customers | Shows relationship strength | |
| Finance | Revenue per Vehicle | Total transport revenue / total vehicles | Evaluates asset profitability |
| Fuel Cost % of Total Expense | Proportion of fuel cost in total expense | Tracks major cost contributor | |
| Revenue Leak % | Difference between billed and actual revenue | Detects underbilling or process loss | |
| HR | Driver Turnover Rate | % of drivers leaving per year | High turnover disrupts operations |
| Training Hours per Driver | Avg. annual training hours | Reflects safety & skill development focus |
🏭 2. Supply Chain, Warehousing & 3PL KPIs
| Function | KPI Name | What It Measures | Why It Matters |
|---|---|---|---|
| Operations | Order Fulfilment Rate | % of orders fulfilled without errors or delays | Measures service reliability |
| Warehouse Space Utilization % | Used space vs total available | Optimizes storage efficiency | |
| Inventory Accuracy % | System stock vs physical stock | Ensures data integrity for operations | |
| Order Picking Accuracy | % of orders picked without error | Direct impact on customer satisfaction | |
| Dock-to-Stock Time | Time from receipt to put away | Reflects process speed | |
| Cost per Order | Total warehouse cost / orders processed | Key to understanding efficiency | |
| Sales & BD | New Client Acquisition Rate | Number of new customers per period | Measures business growth |
| Contract Renewal Rate | % of clients renewing contracts | Indicates long-term relationship success | |
| Value per Order | Average billing per customer | Tracks account profitability | |
| Customer Service | On-Time Dispatch Rate | % of shipments dispatched as per SLA | Core service reliability metric |
| Customer Satisfaction (CSAT) | Average customer feedback score | Reflects overall service experience | |
| SLA Compliance % | Shipments meeting SLA parameters | Measures reliability & credibility | |
| Finance | Cost per Sq. Ft. Managed | Total cost of warehousing / total space | Monitors cost efficiency |
| Revenue per Client | Total revenue / number of active clients | Evaluates client value | |
| DSO (Days Sales Outstanding) | Avg. time to collect payments | Tracks cash flow efficiency | |
| HR | Labor Productivity | Orders processed per worker per shift | Direct measure of workforce efficiency |
| Absenteeism Rate | % of unplanned absences | Impacts daily productivity | |
| Training Investment per Employee | Annual training spend per employee | Indicates focus on skill enhancement |
✈️ 3. Freight Forwarding KPIs
| Function | KPI Name | What It Measures | Why It Matters |
|---|---|---|---|
| Operations | On-Time Shipment % | % of shipments meeting scheduled dispatch & delivery | Reflects service reliability |
| Delay Causes by Reason | Internal vs External delay factors | Identifies root causes of inefficiency | |
| Revenue per Shipment | Average income per shipment | Tracks shipment-level profitability | |
| Cost per Shipment | Total cost per job | Key financial performance metric | |
| Carrier Performance Index | % of shipments handled successfully by each carrier | Helps negotiate better carrier contracts | |
| Customs Clearance Time | Avg. clearance duration per shipment | Measures process efficiency | |
| Sales & BD | Quote-to-Booking Ratio | Quotes converted to confirmed jobs | Sales performance indicator |
| Lane Profitability | Profit per trade lane or route | Guides business focus and pricing | |
| Customer CLV (Lifetime Value) | Long-term value of each client | Helps prioritize key accounts | |
| Customer Service | Shipment Tracking Accuracy | % of shipments tracked correctly | Impacts client trust and transparency |
| Claims Ratio | % of damaged/lost shipment claims | Tracks service quality & risk control | |
| CSAT (Customer Satisfaction Score) | Feedback on service experience | Benchmark for loyalty and retention | |
| Finance | Revenue Leak % | Losses due to process or billing errors | Identifies profit drain areas |
| Gross Margin per Shipment | Revenue – direct cost | Shows operational profitability | |
| Cost Recovery % | Recovered costs vs billed costs | Monitors billing efficiency | |
| HR | Employee Utilization % | Productive hours vs available hours | Measures workforce effectiveness |
| Attrition Rate | % of staff turnover | Affects service continuity and quality | |
| Compliance Training Completion % | % of staff trained on regulatory areas | Ensures compliance & quality consistency |
Conclusion
For MSME leaders, KPIs are not just metrics — they’re your business heartbeat.
Each number tells a story: of reliability, efficiency, or risk.
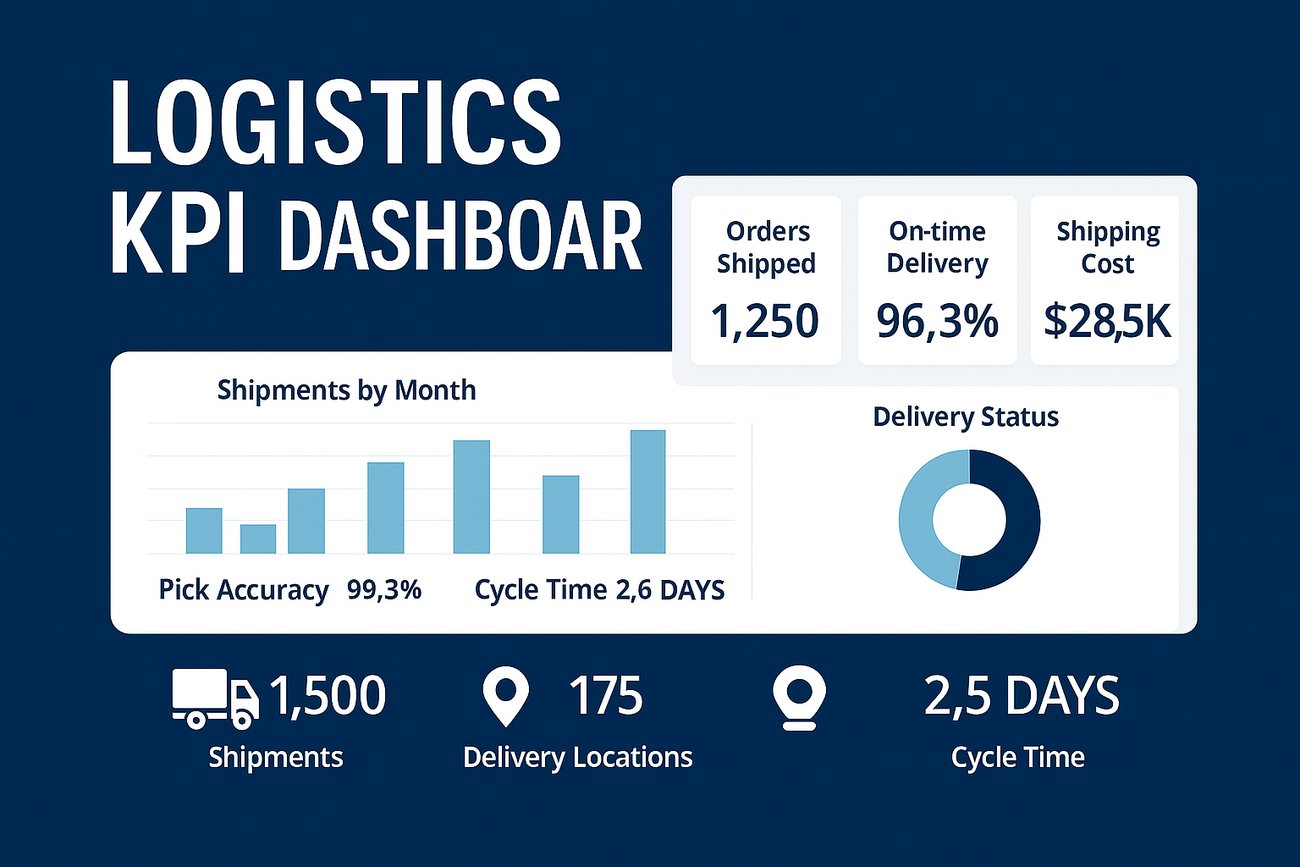
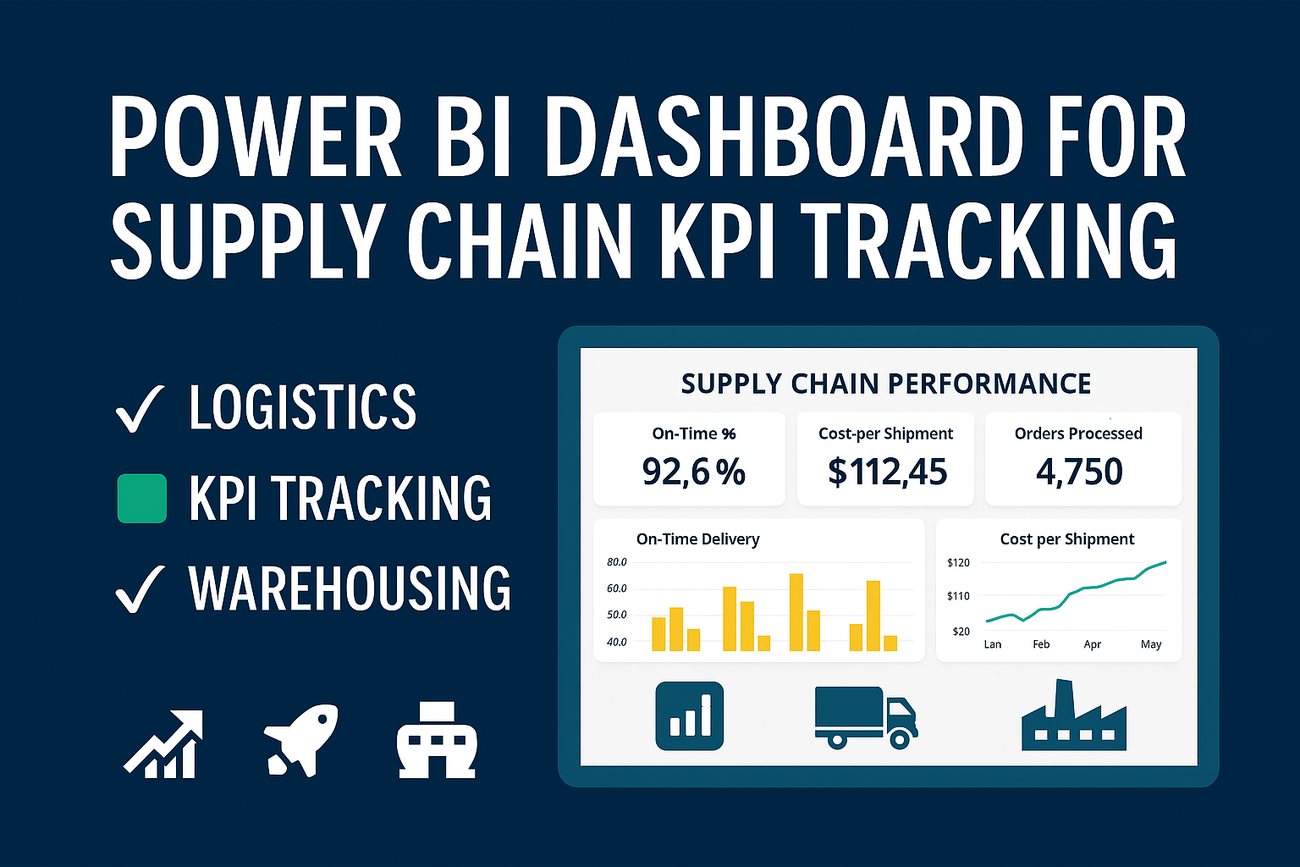
When integrated into Power BI dashboards, these KPIs evolve from static reports into real-time performance intelligence — enabling faster, smarter, and validated decisions.
As a Business Intelligence specialist, I help MSMEs design custom KPI dashboards that unify operations, sales, customer service, finance, and HR — all in one live visual platform.
🔗 Call to Action
Want to see your logistics or freight business through a KPI-driven Power BI dashboard?
Let’s build a data intelligence framework tailored for your MSME.